01 · UAB's case
UAB's offense leads its matchup in
UAB's offense was in the 58th percentile for success rate last season. Charlotte's defense was in the 0th percentile for success rate allowed.
See the underlying numbersSaturday, November 7
Create custom report
4–4
vs
Charlotte
1–7
3:30 PM ET2:30 PM CTProtective StadiumBirmingham, AL
Partly cloudy64°FN 12 mphGusts 16 mphPrecip 0%
At kickoff · 2:30 PM CT · Updated 12:26 PM CT · National Weather Service
Birmingham · local time (CT)
Kickoff hour
Partly cloudy64°FN 12 mphGusts 16 mphPrecip 0%
Weather is not an input to the SBR forecast.
Evidence sections show 2025 background.
Scheduled game
Overview
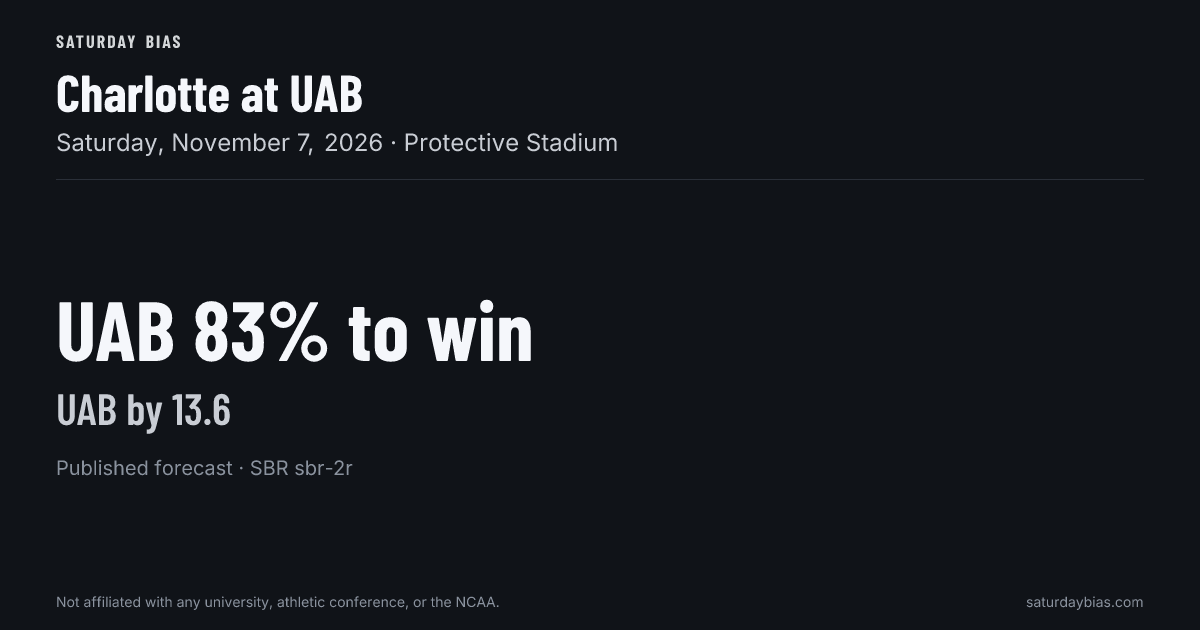
83%
UAB win probability
Charlotte 17%
UAB by 13.6
Projected margin
Margin uncertainty ±14.0 points
Published forecast · SBR sbr-2r · Model track record
This is our published forecast for this game. It comes from each team's SBR rating and a 2.5-point home-field adjustment (none at a neutral site).
The win chance also allows for how sure we are of each team's rating.
A breakdown of this published number isn't available: we don't save the ratings it was calculated from alongside the forecast.
01 · UAB's case
UAB's offense was in the 58th percentile for success rate last season. Charlotte's defense was in the 0th percentile for success rate allowed.
See the underlying numbers02 · Charlotte's answer
None of its defense's numbers stood out against UAB's offense last season.
03 · What could swing it
The model gives UAB a 83% chance to win and predicts UAB by 13.6 points. That margin has an uncertainty of ±14.0 points.
See the forecastMatchups
Offensive efficiency meets defensive efficiency. Percentiles run from 0 to 100.
PPA and success rate: CFBD, 2025 full season, garbage time included. Points per game: every 2025 game. Percentiles and ranks are among 2025 teams.
PPA and success rate: CFBD, 2025 full season, garbage time included. Points per game: every 2025 game. Percentiles and ranks are among 2025 FBS teams.
Defense is oriented so a higher percentile is stronger.
Follow the direction. Check the production.
Offense moving upfield ↑
Jalen Kitna · 77% of charted pass attempts
326 of 335 have a direction · 9 unknown, excluded · rounded
Charted 12 of 12 games
Efficiency charted in 12 of 12 games
Depth as written in the play-by-play: 295 short · 31 deep · 9 not stated
UAB's line averages 315.0 lbs against Charlotte's 260.5 lbs front — an edge of 54.5 lbs a man.
Typical FBS gap: 31.0 lbs.
Roster size is context. It isn't a forecast advantage.
| Matchup | O-line | D-line |
|---|---|---|
| UAB OLUAB OL vs Charlotte DL | 315.0 lbs | 260.5 lbs |
| Charlotte OLCharlotte OL vs UAB DL | 302.8 lbs | 281.3 lbs |
Average listed roster weight, 2026 · bars run from 0 to 350 lbs.
UAB line yards 2.93 · Charlotte stuff rate 19.2%
Charlotte line yards 2.45 · UAB stuff rate 12.6%
Fans swear big lines win games. They're half right — big-line teams do win more, but only because good programs recruit big linemen. Once we account for talent and last season, line size adds nothing to the prediction. Across 11 seasons, no measurable effect on margin.
Players
The UAB offense in 2025
QB · 10 games
223/337 · 66% season
Last game
Tulsa · Nov 29, 2025: 14/17, 166 yds, 2 TD, 0 INT
RB · 12 games
Last game
Tulsa · Nov 29, 2025: 23 carries, 117 yds, 2 TD
WR · 12 games
Last game
Tulsa · Nov 29, 2025: 5 rec, 46 yds, 1 TD
Who is producing
2025 evidence · 12 games in this window · 12 with recorded rows in this view
Sorted by Completions and attempts, highest first
| Player | ||||||
|---|---|---|---|---|---|---|
| Jalen KitnaQB | 10 | 223 / 337 | 2,462 | 7.3 | 13 | 11 |
| Ryder BurtonQB | 7 | 62 / 98 | 708 | 7.2 | 7 | 5 |
| Nate RogersQB | 2 | 1 / 2 | 0 | 0.0 | 0 | 0 |
| Iverson HooksWR | 1 | 1 / 1 | 17 | 17.0 | 0 | 0 |
4 players with recorded rows
Rows are recorded player-game box lines for the games listed above. A missing row is missing data, not proof that a player did not appear, and none of these figures describe targets, snaps, starters or availability.
Who is producing
2025 evidence · 12 games in this window · 12 with recorded rows in this view
Sorted by Completions and attempts, highest first
| Player | ||||||
|---|---|---|---|---|---|---|
| Grayson LoftisQB | 11 | 128 / 232 | 1,415 | 6.1 | 8 | 8 |
| Conner HarrellQB | 4 | 64 / 96 | 737 | 7.7 | 4 | 2 |
| Zach WilckeQB | 6 | 33 / 51 | 296 | 5.8 | 2 | 3 |
3 players with recorded rows
Rows are recorded player-game box lines for the games listed above. A missing row is missing data, not proof that a player did not appear, and none of these figures describe targets, snaps, starters or availability.
Team context
2025 season. Percentiles and ranks are among 2025 FBS teams.
Recruited classes aren't the roster that takes the field.
Season percentiles · outward is stronger · recruiting and experience are context, not forecast weights
UAB: solid line, circles · Charlotte: dashed line, squares
SP+ percentile among FBS teams, by season. The marked point is each compared season.
Recruiting-class percentile feeding each roster, compared with its SP+ result.
Most recent completed 2025 games · play stats exclude garbage time
Nov 29 · 74 recorded plays
W 31–24
42%
Success rate
0.19
PPA / play
Nov 22 · 65 recorded plays
L 18–48
38%
Success rate
0.04
PPA / play
Nov 15 · 72 recorded plays
L 24–53
44%
Success rate
0.26
PPA / play
Alex Mortensen
no career rating on file
Todd Fitch
career +24.7 SP+ offense
Nate Faanes
career +31.8 SP+ defense
A new coordinator feels like it should swing a game. Across 11 seasons, the change doesn't move the final margin beyond what the roster already tells us. Shown as context, not a factor in our number.
2026 UAB
OC
Scheme: Multiple (listed on Wikipedia)
Style: Run-heavy, average pace (threw on 38% of its run–pass plays, 9th percentile of 2026 FBS; 67.5 plays a game, 51st percentile)
DC
Scheme: 3–4 (listed on Wikipedia)
2026 Charlotte
OC
Scheme: Spread option (listed on Wikipedia)
Style: Pass-heavy, grind-it-out (threw on 50% of its run–pass plays, 74th percentile of 2026 FBS; 61.4 plays a game, 8th percentile)
DC
Scheme: 4–2–5 (listed on Wikipedia)
Run-heavy team meets a defense that can't stop the run — feels like extra points waiting. Across 7 seasons the matchup adds nothing beyond what the two ratings already say; if anything the point estimate leans the other way.
2024 · Charlotte 29, UAB 27
Jerry Richardson Stadium
2022 · UAB 34, Charlotte 20
Protective Stadium
2018 · UAB 28, Charlotte 7
Legion Field
2017 · Charlotte 25, UAB 24
Jerry Richardson Stadium
365 miles apart
Straight-line distance between the two home stadiums, not travel distance.
Evidence and sharing
Evidence window: 2025 full season
Pasting the link anywhere unfurls the graphic automatically.