Retrospective · games already played
Goofy Stats
We read the play-by-play of every game we could get and went looking for patterns that do not matter. Here are four of them. Every number on this page is a count over games that have already finished.
4,244 games · 2021–2025 · through week 14 of 2025
Play-by-play last pulled August 31, 2026.
This means nothing. We checked.
Each stat below is drawn against the number it would show if nothing were going on. Most of them land on it.
The coin toss
Somebody flips a coin, somebody guesses, and then a football game happens.
Every season we have. Nothing sat this one out.
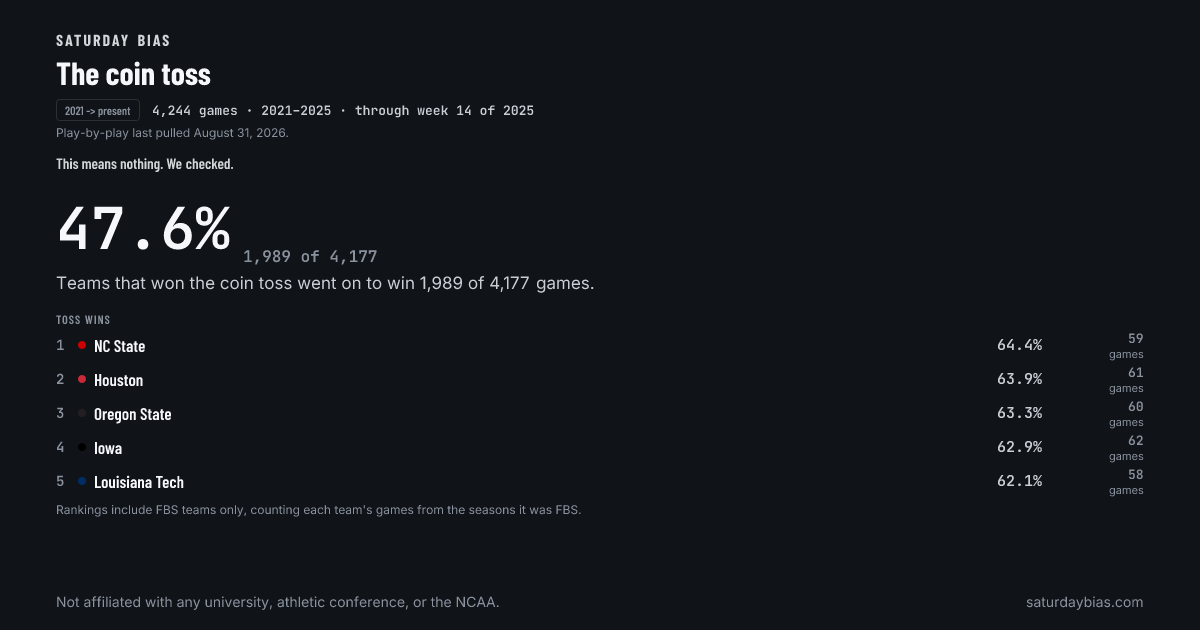
Teams that won the coin toss went on to win 1,989 of 4,177 games.
Nothing would be 50%·2.4 points below
A coin comes up heads half the time. This is a picture of a coin coming up heads half the time.
What the winner did about it
Winners deferred 3,363 of the 4,016 tosses where the feed said what they chose.
Nothing would be 50%·33.7 points above
207 more tosses were won without the feed recording the choice. They are counted as neither.
Which end zone they picked
Stadiums are mostly built north to south, so teams mostly defend north or south. That is the whole finding.
Toss records, by team
Ranked by toss wins. Ranked rows need at least 20 games. Below that a percentage is one play wide, so these are counted but not ranked. Showing the top 10 of 134 teams that clear it.
Rankings include FBS teams only, counting each team's games from the seasons it was FBS.
| # | team | Split | Won the toss | Lost it | n |
|---|---|---|---|---|---|
| 1 | NC State | 64.4% | 35.6% | 59 | |
| 2 | Houston | 63.9% | 36.1% | 61 | |
| 3 | Oregon State | 63.3% | 36.7% | 60 | |
| 4 | Iowa | 62.9% | 37.1% | 62 | |
| 5 | Louisiana Tech | 62.1% | 37.9% | 58 | |
| 6 | Nevada | 61.7% | 38.3% | 60 | |
| 7 | Colorado | 60.0% | 40.0% | 60 | |
| 8 | Navy | 58.6% | 41.4% | 58 | |
| 9 | App State | 58.3% | 41.7% | 60 | |
| 10 | Jacksonville State | 58.3% | 41.7% | 36 |
Under the floor
2 teams are in the data and under the floor.
- Delaware12 games·8 games short
- Missouri State12 games·8 games short
First to punt
Nobody chooses to punt first. It is the closest thing the sport has to an accident.
Every season we have. Nothing sat this one out.
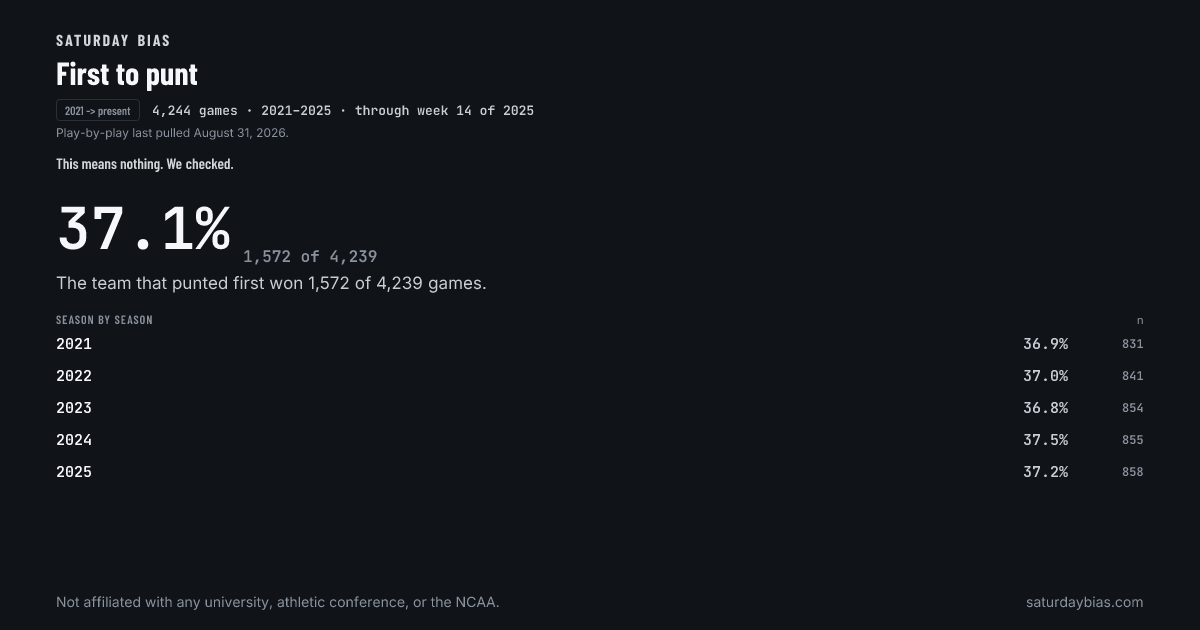
The team that punted first won 1,572 of 4,239 games.
Nothing would be 50%·12.9 points below
That is 12.9 points under a coin flip, and it has stayed under one in every season we have.
Season by season
| Season | Punted first, won | n |
|---|---|---|
| 2021 | 36.9% | 831 |
| 2022 | 37.0% | 841 |
| 2023 | 36.8% | 854 |
| 2024 | 37.5% | 855 |
| 2025 | 37.2% | 858 |
Which way they ran
The stat crew writes down whether a run went left, up the middle, or right. Nobody has ever asked what that adds up to.
2021 sits this one out: 361 of its 832 games came through with no direction words at all.
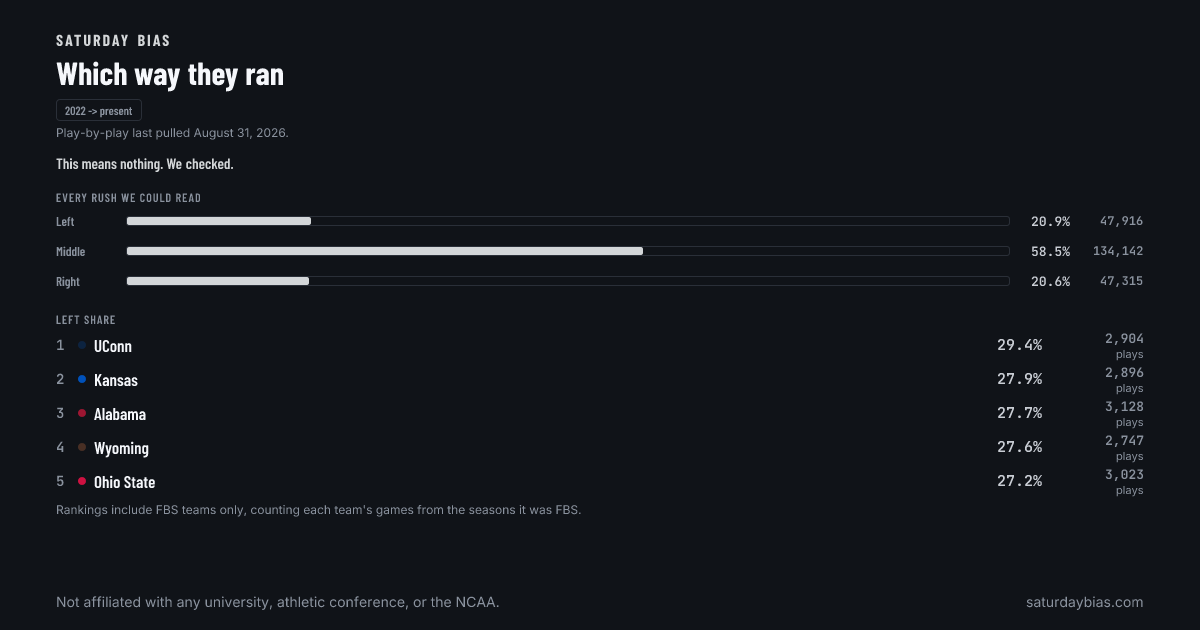
Every rush we could read
Three directions, so nothing is a third each. The middle wins because that is where the ball starts.
Rush direction, by team
Ranked by left share. Ranked rows need at least 120 plays. Below that a percentage is one play wide, so these are counted but not ranked. Showing the top 10 of 136 teams that clear it.
Rankings include FBS teams only, counting each team's games from the seasons it was FBS.
| # | team | Split | Left | Middle | Right | n |
|---|---|---|---|---|---|---|
| 1 | UConn | 29.4% | 35.4% | 35.2% | 2,904 | |
| 2 | Kansas | 27.9% | 48.8% | 23.3% | 2,896 | |
| 3 | Alabama | 27.7% | 46.2% | 26.1% | 3,128 | |
| 4 | Wyoming | 27.6% | 45.4% | 27.0% | 2,747 | |
| 5 | Ohio State | 27.2% | 46.8% | 25.9% | 3,023 | |
| 6 | Boise State | 26.7% | 50.6% | 22.7% | 3,433 | |
| 7 | USC | 26.5% | 48.5% | 25.1% | 3,189 | |
| 8 | Arkansas | 25.7% | 47.2% | 27.0% | 3,052 | |
| 9 | Northern Illinois | 25.7% | 46.0% | 28.3% | 3,057 | |
| 10 | Colorado State | 25.3% | 51.7% | 23.0% | 2,918 |
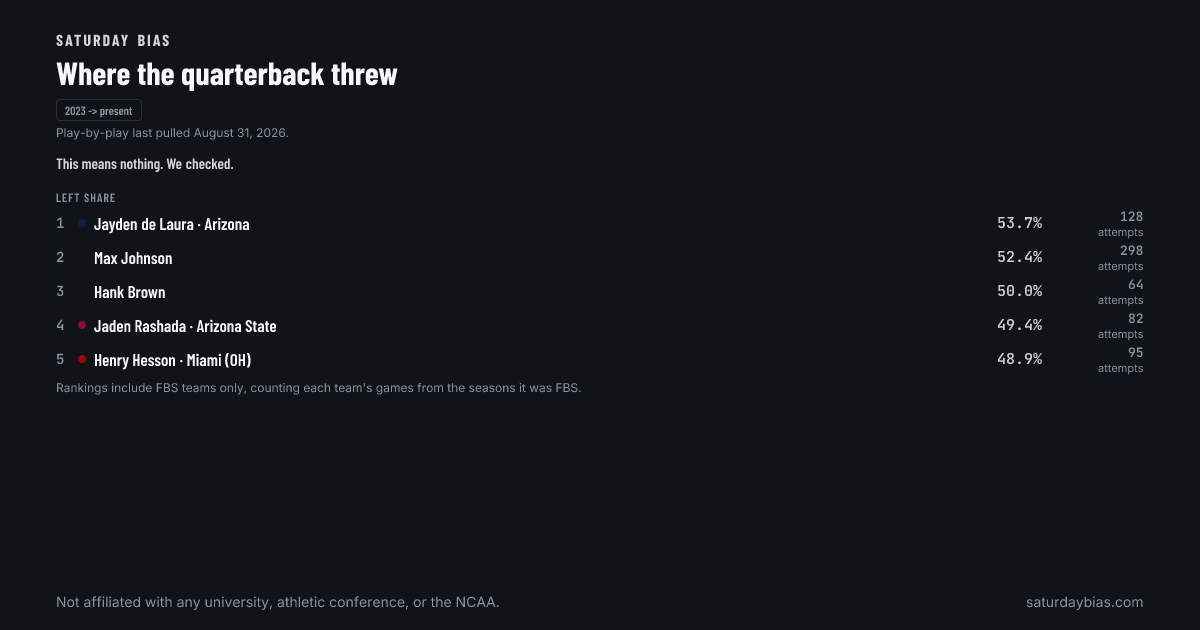
Where the quarterback threw
Same idea, one grain down: every pass the feed gave a direction to, sorted by who threw it.
2021 sits this one out: 832 of its 832 games came through with no short-or-deep wording at all.
2022 sits this one out: 64 of its 841 games came through with no short-or-deep wording at all.
Throw direction, by passer
Ranked by left share. Ranked rows need at least 60 attempts. Below that a percentage is one play wide, so these are counted but not ranked. Showing the top 10 of 388 passers that clear it.
Rankings include FBS teams only, counting each team's games from the seasons it was FBS.
| # | passer | Split | Left | Middle | Right | n |
|---|---|---|---|---|---|---|
| 1 | Jayden de Laura · Arizona | 53.7% | 16.3% | 30.1% | 128 | |
| 2 | Max Johnson | 52.4% | 18.5% | 29.1% | 298 | |
| 3 | Hank Brown | 50.0% | 20.0% | 30.0% | 64 | |
| 4 | Jaden Rashada · Arizona State | 49.4% | 8.9% | 41.8% | 82 | |
| 5 | Henry Hesson · Miami (OH) | 48.9% | 12.0% | 39.1% | 95 | |
| 6 | Jaylen Henderson | 48.4% | 20.4% | 31.2% | 95 | |
| 7 | CJ Harris | 48.2% | 17.9% | 33.9% | 60 | |
| 8 | Nicco Marchiol · West Virginia | 47.5% | 18.7% | 33.8% | 206 | |
| 9 | Gio Lopez | 46.9% | 20.6% | 32.4% | 613 | |
| 10 | Jackson Brousseau · Colorado State | 46.8% | 13.7% | 39.5% | 207 |
Under the floor
1,227 passers are in the data and under the floor.
Closest to clearing:
- Matthew Sluka59 attempts·1 attempts short
- Zach Calzada · Kentucky58 attempts·2 attempts short
- Gaston Moore57 attempts·3 attempts short