01 · Utah's case
Utah's defense leads its matchup in
Utah's defense is in the 96th percentile for points allowed per game this season. Colorado's offense is in the 12th percentile for points per game.
See the underlying numbersSaturday, October 17
Compare these teams
5–0 · AP #11
at

Colorado
2–3
10:15 PM ET8:15 PM MTFolsom FieldBoulder, CO
Clear58°FW 3 mphGusts 7 mphPrecip 3%
At kickoff · 8:15 PM MT · Updated 12:46 PM MT · National Weather Service
Boulder · local time (MT)
Kickoff hour
Clear58°FW 3 mphGusts 7 mphPrecip 3%
Weather is not an input to the SBR forecast.
92%
Utah win probability
Colorado 8%
Utah by 20.2
Projected margin
Margin uncertainty ±14.7 points
Published forecast · SBR sbr-2r · Model track record
01 · Utah's case
Utah's defense is in the 96th percentile for points allowed per game this season. Colorado's offense is in the 12th percentile for points per game.
See the underlying numbers02 · Colorado's answer
In every matchup we can rate this season, the Colorado unit ranks well below the Utah unit it faces.
See when each team has the ball03 · What could swing it
The model gives Utah a 92% chance to win and predicts Utah by 20.2 points. That margin has an uncertainty of ±14.7 points.
See the forecastOffensive efficiency meets defensive efficiency. Percentiles run from 0 to 100.
PPA and success rate: CFBD, 2026 season to date, garbage time included. Points per game: 2026 games so far. Percentiles and ranks are among 2026 teams.
PPA and success rate: CFBD, 2026 season to date, garbage time included. Points per game: 2026 games so far. Percentiles and ranks are among 2026 FBS teams.
Defense is oriented so a higher percentile is stronger.
Follow the direction. Check the production.
Offense moving upfield ↑
Devon Dampier · 70% of charted pass attempts
100 of 101 have a direction · 1 unknown, excluded · rounded
Charted 5 of 5 games
Efficiency charted in 5 of 5 games
Depth as written in the play-by-play: 81 short · 19 deep · 1 not stated
What to watch
Most charted attempts go right (53%). Middle gives the most yards per attempt: 11.0 over 21 attempts with a result.
The Utah offense in 2026
QB · 5 games
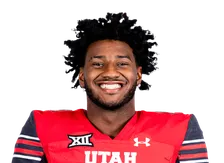
Photo: ESPN
94/131 · 72% season
Last game
Kansas · Oct 10, 2026: 23/30, 238 yds, 3 TD, 1 INT
RB · 5 games
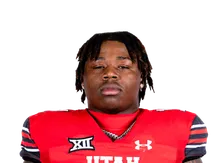
Photo: ESPN
Last game
Kansas · Oct 10, 2026: 16 carries, 171 yds, 2 TD
WR · 5 games
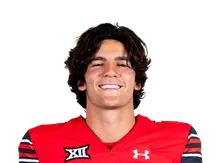
Photo: ESPN
Last game
Kansas · Oct 10, 2026: 7 rec, 72 yds, 0 TD
Who is producing
2026 evidence · 5 games in this window · 5 with recorded rows in this view
Sorted by Completions and attempts, highest first
| Player | ||||||
|---|---|---|---|---|---|---|
| Devon DampierQB | 5 | 94 / 131 | 1,134 | 8.7 | 12 | 2 |
| Byrd FicklinQB | 4 | 10 / 18 | 186 | 10.3 | 2 | 0 |
2 players with recorded rows
Rows are recorded player-game box lines for the games listed above. A missing row is missing data, not proof that a player did not appear, and none of these figures describe targets, snaps, starters or availability.
Who is producing
2026 evidence · 5 games in this window · 5 with recorded rows in this view
Sorted by Completions and attempts, highest first
| Player | ||||||
|---|---|---|---|---|---|---|
| Julian LewisQB | 4 | 61 / 95 | 733 | 7.7 | 6 | 2 |
| Isaac WilsonQB | 3 | 40 / 71 | 443 | 6.2 | 2 | 3 |
| Kaneal SweetwyneQB | 2 | 8 / 12 | 42 | 3.5 | 0 | 0 |
| Joseph WilliamsWR | 2 | 2 / 3 | 49 | 16.3 | 0 | 1 |
4 players with recorded rows
Rows are recorded player-game box lines for the games listed above. A missing row is missing data, not proof that a player did not appear, and none of these figures describe targets, snaps, starters or availability.
Utah's line averages 308.6 lbs against Colorado's 270.0 lbs front — an edge of 38.6 lbs a man.
Typical FBS gap: 31.7 lbs.
Roster size is context. It isn't a forecast advantage.
| Matchup | O-line | D-line |
|---|---|---|
| Utah OLUtah OL vs Colorado DL | 308.6 lbs | 270.0 lbs |
| Colorado OLColorado OL vs Utah DL | 311.2 lbs | 270.4 lbs |
Average listed roster weight, 2026 · bars run from 0 to 350 lbs.
2026 season. Percentiles and ranks are among 2026 FBS teams.
Recruited classes aren't the roster that takes the field.
Season percentiles · outward is stronger · recruiting and experience are context, not forecast weights
Utah: solid line, circles · Colorado: dashed line, squares
Most recent completed 2026 games · play stats exclude garbage time
Oct 10 · 78 recorded plays
W 41–24
54%
Success rate
0.31
PPA / play
Sep 26 · 61 recorded plays
W 31–17
52%
Success rate
0.31
PPA / play
Sep 19 · 54 recorded plays
W 33–0
44%
Success rate
0.32
PPA / play
Morgan Scalley
no career rating on file
Kevin McGiven
career +26.0 SP+ offense
Colton Swan
no career rating on file
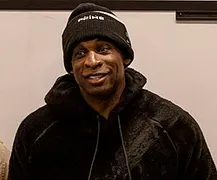
Deion Sanders
career −1.7 SP+ overall
Photo: U.S. Marine Corps photo by Sgt. Lydia Gordon, Public domain
Brennan Marion
career +32.4 SP+ offense
Chris Marve
career +22.8 SP+ defense
2025 · Utah 53, Colorado 7
Rice-Eccles Stadium
2024 · Colorado 49, Utah 24
Folsom Field
2023 · Utah 23, Colorado 17
Rice-Eccles Stadium
2022 · Utah 63, Colorado 21
Folsom Field
2021 · Utah 28, Colorado 13
Rice-Eccles Stadium
2020 · Utah 38, Colorado 21
Folsom Field
2019 · Utah 45, Colorado 15
Rice-Eccles Stadium
2018 · Utah 30, Colorado 7
Folsom Field
2017 · Utah 34, Colorado 13
Rice-Eccles Stadium
2016 · Colorado 27, Utah 22
Folsom Field
2015 · Utah 20, Colorado 14
Rice-Eccles Stadium
2014 · Utah 38, Colorado 34
Folsom Field
2013 · Utah 24, Colorado 17
Rice-Eccles Stadium
2012 · Utah 42, Colorado 35
Folsom Field
2011 · Colorado 17, Utah 14
Rice-Eccles Stadium
Evidence window: 2026 season to date