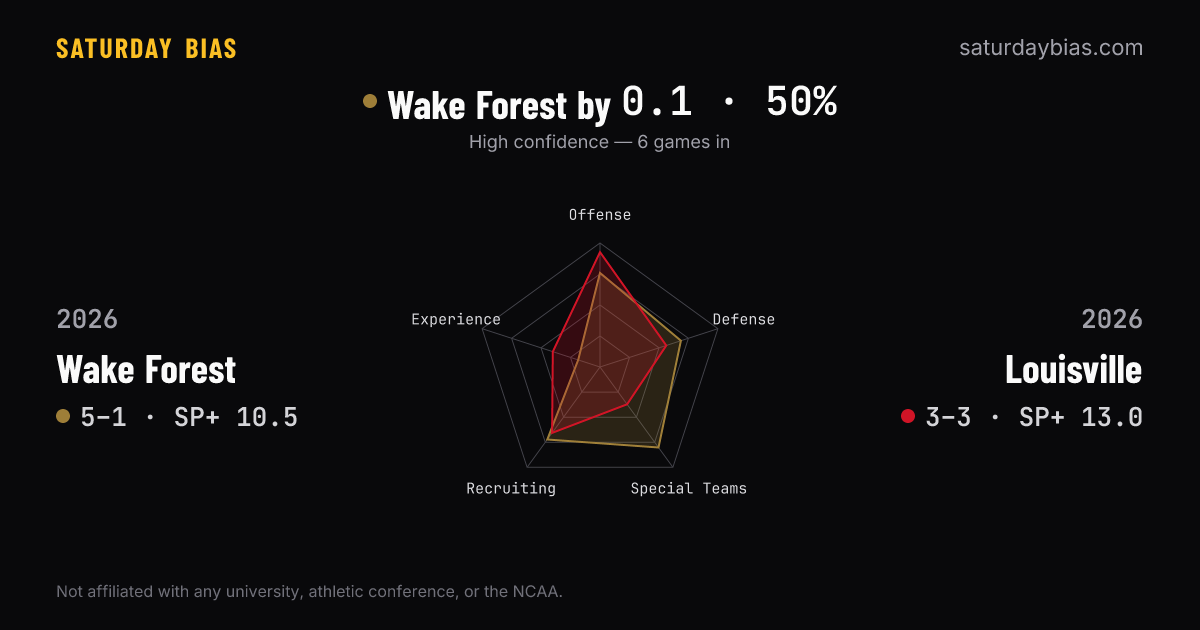
2026 Wake Forest vs 2026 Louisville
Hypothetical
57% to win
High confidence — 6 games in — see our accuracy
Hypothetical forecast · SBR sbr-2r
Why this number
How they're built
0–100 percentile · higher is stronger
Compare the whole profile, then explore each dimension.
- 2026 Wake Forest Offense · SP+ 2026: 32.6, 76th percentile (2026 season to date)
- 2026 Louisville Offense · SP+ 2026: 38.0, 93rd percentile (2026 season to date)
- 2026 Wake Forest Defense · SP+ 2026: 22.3, 69th percentile (2026 season to date)
- 2026 Louisville Defense · SP+ 2026: 25.0, 56th percentile (2026 season to date)
- 2026 Wake Forest Special teams · SP+ 2026: 0.3, 80th percentile (2026 season to date)
- 2026 Louisville Special teams · SP+ 2026: 0.0, 37th percentile (2026 season to date)
- 2026 Wake Forest Recruiting · 2026 signing class: 217.9 pts, 72nd percentile (2026 signing class)
- 2026 Louisville Recruiting · 2026 signing class: 211.7 pts, 66th percentile (2026 signing class)
- 2026 Wake Forest Experience · returning production 2026: 14% returning, 19th percentile (2026 roster)
- 2026 Louisville Experience · returning production 2026: 35% returning, 40th percentile (2026 roster)
Offensive production relative to that season’s field. Compare an offense with the opposing defense in the scouting report.
Recruiting and experience add context; the five axes aren't equal weights in the forecast.
The numbers behind the profiles
| Measure | 2026 Wake Forest | 2026 Louisville |
|---|---|---|
| Offensive / play | 0.3190th percentile | 0.3496th percentile |
| PPA allowed / play | 0.0842nd percentile | 0.1232nd percentile |
| Points per game | 36.880th percentile6 games | 39.589th percentile6 games |
| per game | 21.563rd percentile6 games | 27.724th percentile6 games |
Programs don't stand still
SP+ percentile among FBS teams, by season. The marked point is each compared season.
Momentum
Talent in, results out
Recruiting-class percentile feeding each roster, compared with its SP+ result.
- Average signing-class percentile, classes 2023–2026
- 62nd percentile
- SP+ percentile, 2026
- 74th percentile
- Average signing-class percentile, classes 2023–2026
- 63rd percentile
- SP+ percentile, 2026
- 82nd percentile
Campus distance
335 miles apart
There's more to the matchup.
Supporting context, ready when you want it.
In the trenches · both directions
| Matchup | O-line | D-line |
|---|---|---|
| 2026 Wake Forest OL vs 2026 Louisville DL | 302.7 lbs | 276.5 lbs |
| 2026 Louisville OL vs 2026 Wake Forest DL | 304.7 lbs | 273.0 lbs |
2026 Wake Forest line yards 3.02 · 2026 Louisville stuff rate 11.6%
2026 Louisville line yards 2.97 · 2026 Wake Forest stuff rate 24.2%
Fans swear big lines win games. They're half right — big-line teams do win more, but only because good programs recruit big linemen. Once we account for talent and last season, line size adds nothing to the prediction. Across 11 seasons, no measurable effect on margin.
Roster size is context. It isn't a forecast advantage.
Backtested effect: 0.42 pts at 1σ.
Head-to-head · Louisville leads 7–4 since 2000
Wake Forest has won 1 straight
| Season | Score | Venue |
|---|---|---|
| 2026 | Wake Forest 30–27 Louisville | L&N Federal Credit Union Stadium · Louisville home |
| 2022 | Wake Forest 21–48 Louisville | L&N Federal Credit Union Stadium · Louisville home |
| 2021 | Wake Forest 37–34 Louisville | Allegacy Federal Credit Union Stadium · Wake Forest home |
| 2020 | Wake Forest 21–45 Louisville | L&N Federal Credit Union Stadium · Louisville home |
| 2019 | Wake Forest 59–62 Louisville | Allegacy Federal Credit Union Stadium · Wake Forest home |
| 2018 | Wake Forest 56–35 Louisville | L&N Federal Credit Union Stadium · Louisville home |
| 2017 | Wake Forest 42–32 Louisville | Allegacy Federal Credit Union Stadium · Wake Forest home |
| 2016 | Wake Forest 12–44 Louisville | L&N Federal Credit Union Stadium · Louisville home |
| 2015 | Wake Forest 19–20 Louisville | Allegacy Federal Credit Union Stadium · Wake Forest home |
| 2014 | Wake Forest 10–20 Louisville | L&N Federal Credit Union Stadium · Louisville home |
| 2006bowl/playoff | Wake Forest 13–24 Louisville | Neutral site |
Coaching & program context
HC
- Jake Dickert
OC
- Rob Ezell
career average +28.3 SP+ offense
Scheme: Spread (listed on Wikipedia)
Style: Balanced, average pace (threw on 48% of its run–pass plays, 63rd percentile of 2026 FBS; 66.8 plays a game, 45th percentile)
DC
- Scottie Hazelton
career average +25.7 SP+ defense
Scheme: 4–2–5 (listed on Wikipedia)
HC
- Jeff Brohm
OC
- Brian Brohm
career average +33.4 SP+ offense
Scheme: Spread (listed on Wikipedia)
Style: Run-heavy, grind-it-out (threw on 42% of its run–pass plays, 27th percentile of 2026 FBS; 64.2 plays a game, 26th percentile)
DC
- Mark Ivey (co-DC)
- Steve Ellis (co-DC)
career average +35.4 SP+ defense
Scheme: Multiple 4–2–5 (listed on Wikipedia)
A new coordinator feels like it should swing a game. Across 11 seasons, the change doesn't move the final margin beyond what the roster already tells us. Shown as context, not a factor in our number.
Run-heavy team meets a defense that can't stop the run — feels like extra points waiting. Across 7 seasons the matchup adds nothing beyond what the two ratings already say; if anything the point estimate leans the other way.
Scouting reports
No upcoming game between these teams is on the schedule.
Share this matchup
Pasting the link anywhere unfurls the graphic automatically.